Mr.Kitiporn Malingern/iStock via Getty Images
In September of 2017, I received slightly over $100K from my former employer which represented the commuted value of my pension plan. I decided to invest 100% of this money in dividend growth stocks.
Each month, I publish my results on those investments. I don’t do this to brag. I do this to show my readers that it is possible to build a lasting portfolio during all sorts of market conditions. Some months we might appear to underperform, but you must trust the process over the long term to evaluate our performance more accurately.
Performance in Review
Let’s start with the numbers as of May 5th, 2022 (before the bell):
Original amount invested in September 2017 (no additional capital added): $108,760.02.
- Portfolio value: $210,467.87
- Dividends paid: $4,070.50 (TTM)
- Average yield: 1.93%
- 2021 performance: +16.78%
- SPY = 28.75%, XIU.TO = 28.05%
- Dividend growth: +3.14%
Total return since inception (Sep 2017- May 2022): 93.52%
Annualized return (since September 2017 – 55 months): 15.49%
SPDR S&P 500 ETF Trust (SPY) annualized return (since Sept 2017): 14.78% (total return 88.10%)
iShares S&P/TSX 60 ETF (XIU) annualized return (since Sept 2017): 11.62% (total return 65.50%)
Author
Mr. Market is Moody – It Hurts Your Recent Purchase
Since the beginning of the year, it seems that for every good day on the market, you get 3 bad ones. Sometimes, it even starts in the green and ends up in the red (or vice-versa). Why is that? Probably because we have been crushing all-time high records month after month, quarter after quarter, year after year for a very long time.
In Canada, the energy sector saved the day for a while, but there is a limit to what a single sector (even important) can do to lift an entire market. If you haven’t made many transactions in your portfolio like me in the past few years, you probably don’t mind much. After a while, short-term fluctuations aren’t that bad because you “run on profit”. In other words, when a stock goes down by 20%, but your total return on this investment is still +56%, it doesn’t hurt as much as you are still in positive territory.
However, I can appreciate how you might feel if you bought TFI International (TFII) (-25% YTD), goeasy (OTCPK:EHMEF) (-33%), Innovative Industrial Properties (IIPR) (-42%) or Air Products and Chemicals (APD) (-21%) in January 2022. Strangely enough, your perspective would be completely different if you had bought them 3 years ago as you would still be showing profits on these investments.
Author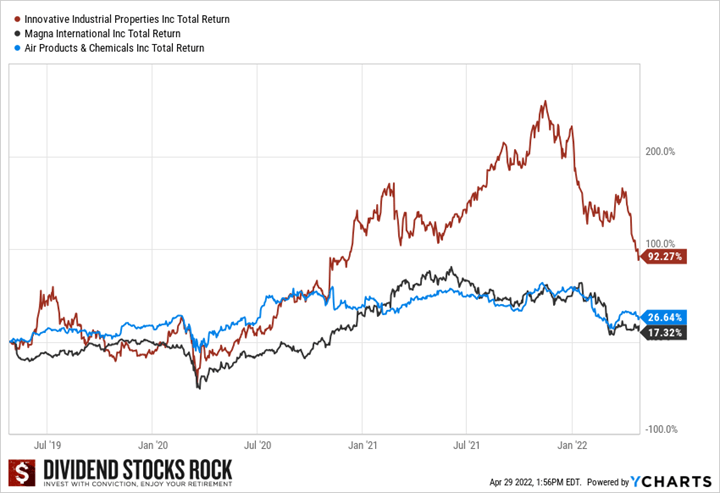
I noticed in the latest webinars that many questions were formulated like this:
“Why company ABC is down 20%?“
You can certainly do a lot of digging and find an explanation (there is always a good reason to explain stock movements). This could satisfy your curiosity and make you feel better about the paper loss in your account. But, respectfully, I think you are asking the wrong question. The question you should be asking is:
“Is company ABC still in line with my original investment thesis?”
The market is filled with short-term investors that don’t have the same investment goals as you. They focus on performance for the next week, next month or the next quarter. As a dividend investor, you are smarter than this. You focus on the next decade, 25 years, half a century. If you don’t believe me, here’s an example for you to consider. Consider this stock price graph of TFI International (TFII.TO) for a nine-month period (please note that I’ve taken the year off the chart on purpose):
Author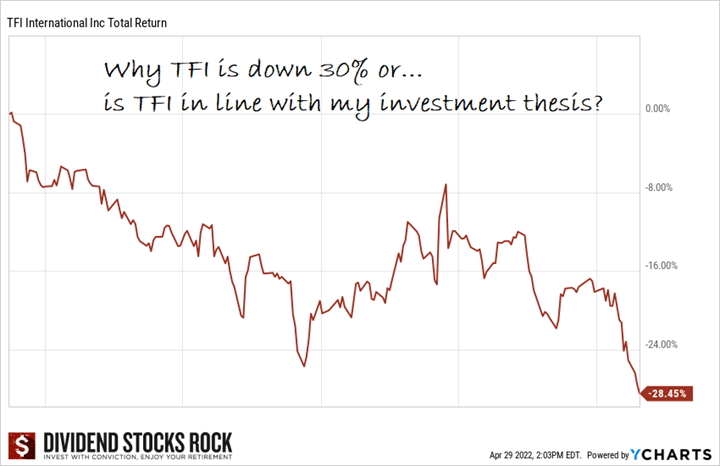
This graph shows how TFI stock (known as Transforce back then) went down from April 2015 to January 2016. Nine months and investors were down almost 30%! In 2015, the economy wasn’t that great, and we were in the middle of another oil turmoil and investors were nervous.
Interestingly, we featured TFI in a DSR newsletter in July 2016 as one of the best plays in the industrial sector at that time. Here’s what I wrote:
With lots of cash in its hand and a weaker economy outlook, many analysts anticipate a merger or acquisitions from TFI to make it even stronger when the economy bounces back. The stock is down 9% for the past 12 months and keeps dragging behind the TSX since the beginning of the year, this could represent a great buying opportunity.”
You already know the rest of the story (TFI was also added to some of our DSR portfolios back then), but imagine what investing with conviction (e.g., with a strong belief in your investment thesis) would have done after seeing the stock going down 30%…
Author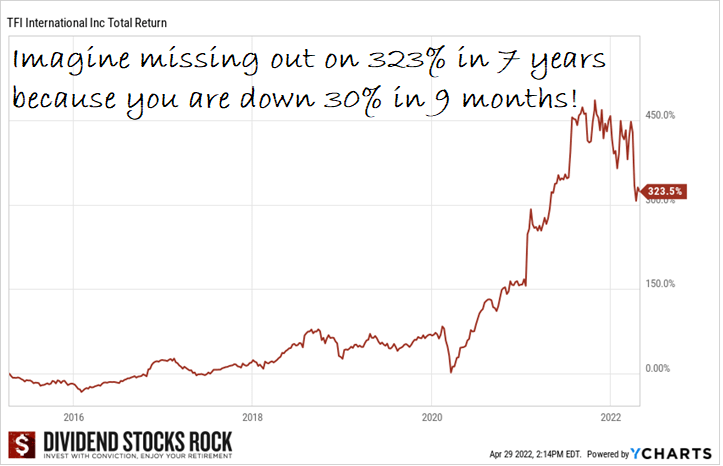
When I look at this graph, there are two things that stand out for me:
#1 TFI went through an amazing growth phase mostly related to the DSR investment thesis announced in 2016.
#2 Even after the current correction of the stock, we are just trading at last year’s levels.
Again, I get it, it sucks when you buy shares of a stock, and it drops 20%+ a few months later. I’ve experienced that many times too. In an ideal world, we would have waited for that perfect moment to buy. Unfortunately, crystal balls are also victims of supply chain disruptions, and we can’t find them anywhere. The good thing to do is to take more time to write down your investment thesis to invest with more conviction.
It doesn’t look like this, but great companies always come back full strength and become winners on the stock market.
Keep that in mind for the coming months.
Smith Manoeuvre Update
Last month, I told you I had started a Smith Manoeuvre (a leveraged operation) where I will borrow $500 per month to invest in the stock market. I’ve already shared my first purchase (Canadian Net REIT NET.UN.V) and I was ready to make my second $500 purchase in April.
I’m not going to surprise anyone with my second pick: National Bank (NA.TO) (OTCPK:NTIOF). Do I need to explain myself here? More seriously, when I look at my “SM list” and saw that NA.TO went from $100 to $90, I couldn’t help but add more of this amazing dividend grower.
As you can know, I’m starting this portfolio by focusing on the growth segment. A few members have asked me why I picked NET.UN as my first holding. There isn’t exactly a clear answer to that question as many of the 22 stocks from that list would have been a good pick. I have a preference at this point to buy companies with a variety of growth vectors. This is the case for both NET.UN and NA.
I told you I opened a margin account and that it wasn’t the plan to go on margin at this point. However, having a margin account offers flexibility when you trade with small amounts. With a deposit of $500, I was a bit short to buy six shares of National Bank at $90.48 ($542.88). I had, therefore, two options:
#1 buy five shares and leave about $50 in the cash account (which is 10% of the amount to be invested)
#2 use the margin for the difference (which happened to be $38 since I had received a dividend from NET already).
I decided to use the margin for this small amount. I don’t expect to use it all the time, but it will help me in getting invested more efficiently. Here’s my portfolio as of May 5th:
| Company Name | Ticker | Sector | Market Value |
| Canadian Net REIT | NET.UN. V | Real Estate | $486.70 |
| National Bank | NA.TO | Financials | $557.64 |
| Cash (Margin) | -$36.51 | ||
| Total | $1,007.83 |
Let’s look at my CDN portfolio. Numbers are as of May 5th, 2022 (before the bell):
Canadian Portfolio (CAD)
| Company Name | Ticker | Sector | Market Value |
| Algonquin Power & Utilities | AQN.TO (AQN) | Utilities | $6,061.32 |
| Alimentation Couche-Tard | ATD.B.TO (OTCPK:ANCUF) | Cons. Staples | $20,638.91 |
| National Bank | NA.TO | Financials | $11,245.74 |
| Royal Bank | RY.TO | Financial | $7,956.00 |
| Brookfield Renewable | BEPC.TO (BEP) | Utilities | $6,746.85 |
| CAE | CAE.TO (CAE) | Industrials | $6,280.0 |
| Enbridge | ENB.TO (ENB) | Energy | $9,262.33 |
| Fortis | FTS.TO (FTS) | Utilities | $6,039.99 |
| Magna International | MG.TO (MGA) | Cons. Discre. | $5,599.30 |
| Sylogist | SYZ.TO (OTCPK:SYZLF) | Inf. Technology | $3,356.85 |
| Granite REIT | GRT.UN.TO (GRP.U) | Real Estate | $11,667.20 |
| Cash | 389.33 | ||
| Total | $95,243.82 |
My account shows a variation of -$3,311.64 (-3.36%) since the last income report on April 4th. Since most of my US companies declared their earnings, we’ll have a look at them for this update and I’ll reserve the Canadian companies’ update for June.
Here’s my US portfolio now. Numbers are as of May 5th, 2022 (before the bell):
U.S. Portfolio (USD)
| Company Name | Ticker | Sector | Market Value |
| Activision Blizzard | (ATVI) | Communications | $9,191.84 |
| Apple | (AAPL) | Inf. Technology | $12,451.50 |
| BlackRock | (BLK) | Financials | $9,313.22 |
| Disney | (DIS) | Communications | $5,228.55 |
| Gentex | (GNTX) | Cons. Discret. | $7,139.30 |
| Microsoft | (MSFT) | Inf. Technology | $15,948.90 |
| Starbucks | (SBUX) | Cons. Discret. | $6,939.40 |
| Texas Instruments | (TXN) | Inf. Technology | $8,811.50 |
| VF Corporation | (VFC) | Cons. Discret. | $4,216.05 |
| Visa | (V) | Inf. Technology | $10,726.00 |
| Cash | $334.70 | ||
| Total | $90,300.96 |
The US total value account shows a variation of -$6,707.42 (-6.9%) since the last income report on April 4th. I took a serious beating on my tech stocks, Disney (DIS), and Starbucks (SBUX) (all right, that’s pretty much all of this portfolio!). The market’s move away from growth toward value hurt this portfolio. There were many results that came in over the past few weeks. Let’s look at them!
Activision is slowing down (still no news on the merger)
Activision reported declining sales as compared to the incredible results from the pandemic period. Activision Blizzard’s net bookings were $1.48 billion, as compared with $2.07 billion for the first quarter of 2021. The company should see a revenue boost coming from the launch of its new Diablo franchise Immortal coming in June. While we have no definitive news from the regulators, more than 98% of ATVI shareholders voted in favor of the merger.
Apple is on a roll (did it ever stop?)
Apple did it again! It beat both EPS (+8.6%) and revenue (+8.6%) growth expectations. In detail: iPhone revenue of $50.57B (+5.5%), Mac revenue of $10.44B (+14.6%), iPad revenue of $7.64B (-2%), Wearables, home and accessories of $8.81B (+12.4%) and Service revenue of $19.82B (+17.3%). Revenue increased in all geographic regions besides the rest of Asia (-6.7%) while China’s revenue was up 3.7%. Apple also said it would increase its buyback program by $90 billion and boost its quarterly dividend by 5% to 23 cents per share. Congrats to all Apple shareholders!
BlackRock stock is down, but the business is doing great!
On April 13th, BlackRock reported another killer quarter with EPS up 23% and a dividend increase of 18%. The market was disappointed by only high-single-digit revenue growth (+7%). Results were driven by strong organic growth and 11% growth in technology services revenue, partially offset by lower performance fees. Technology services, including Aladdin, produced $341M in revenue in Q1, vs. $339M in Q4 and $306M in Q1 2021. Aladdin continues to be a strong growth vector and there is much room for expansion as many institutional investors are not using it yet. Although the market wasn’t that great, BLK was able to bring in $114B in net inflows.
Gentex is still struggling
Gentex did better than expected despite reporting declining EPS (-19.5%) and revenues (-3%). Results were affected as global light vehicle production decreased by approximately 5%. Additionally, light vehicle production in the Company’s primary markets of North America, Europe, and Japan/Korea, declined by 11% on a quarter-over-quarter basis. These declines were primarily a result of the ongoing industry-wide component shortages and global supply chain constraints. With a payout ratio of only 33%, we were surprised to not find any indications of a dividend increase.
Microsoft is a beast!
Microsoft continues to impress with another quarter showing double-digit EPS (+14%) and revenue (+18%) growth. The company reported double-digit growth across all business segments. Revenue in Productivity and Business Processes increased 17% thanks to LinkedIn (+34%) and Dynamic products (+22%). Revenue in the Intelligent Cloud increased 26% (Azure was up 46%) and Revenue in More Personal Computing increased by 11% driven by Windows sales (+11% for OEM and +14% for commercial). While the tech sector is going down, MSFT continues to show strong results. We can’t wait to see when the acquisition of ATVI will be approved by regulators!
Starbucks is brewing a great buy opportunity
While the stock is down like SBUX is heading right toward bankruptcy (-30% since the beginning of the year), the iconic coffee brand reported double-digit revenue growth (+14.5%). Strong demand from their U.S. stores compensated for the ongoing lockdown in China which is bad for business. U.S. Comparable transactions were up 5% in the region and a 7% increase in the average ticket was seen. Most importantly, active membership in Starbucks Rewards in the U.S. rose 17% to 26.7M during the quarter. This is the type of business that will eventually turn around and get more love from the market. You have been warned.
Texas Instruments’ future is bright
Texas Instruments reported another strong quarter with double-digit growth (EPS up 26% and revenue up 14%), beating analysts’ expectations. Results were driven mostly by strong demand in the industrial and automotive industries. You can expect this trend to continue for a while. The company continues to fuel growth through R&D investments. In the past 12 months, TXN invested $3.2 billion in R&D and SG&A, invested an additional $2.6 billion in capital expenditures, and returned $5.0 billion to owners.
Visa surfs on traveling activities.
Visa reported strong results (EPS up 30%, revenue up 26%) as consumers kept spending and started traveling again. Net revenues in the fiscal second quarter were $7.2 billion, an increase of 25% driven by the year-over-year growth in payments volume, cross-border volume, and processed transactions. Net revenues increased approximately 27% on a constant-dollar basis. Payment volume rose 17% Y/Y in constant dollars with cross-border volume up 38% and process transactions up 19%. Cross-border volumes excluding transactions within Europe, which drive international transaction revenues, increased 47% on a constant-dollar basis.
My Entire Portfolio Updated for Q1 2022
Each quarter, we run an exclusive report for Dividend Stocks Rock (DSR) members who subscribe to our very special additional service called DSR PRO. The PRO report includes a summary of each company’s earnings report for the period. We have been doing this for an entire year now and I wanted to share my own DSR PRO report for this portfolio. You can download the full PDF showing all the information about all my holdings. Results have been updated as of March 31st, 2022.
Author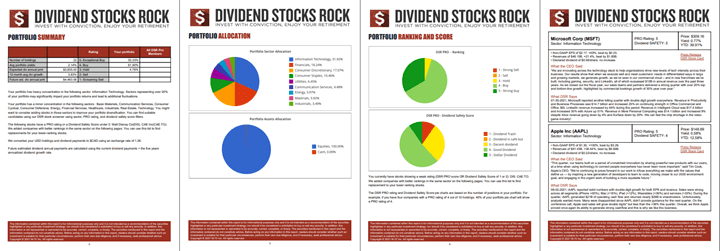
Download my portfolio Q2 2022 report.
Dividend Income: $180.59 CAD (+9.5% vs April 2021)
Author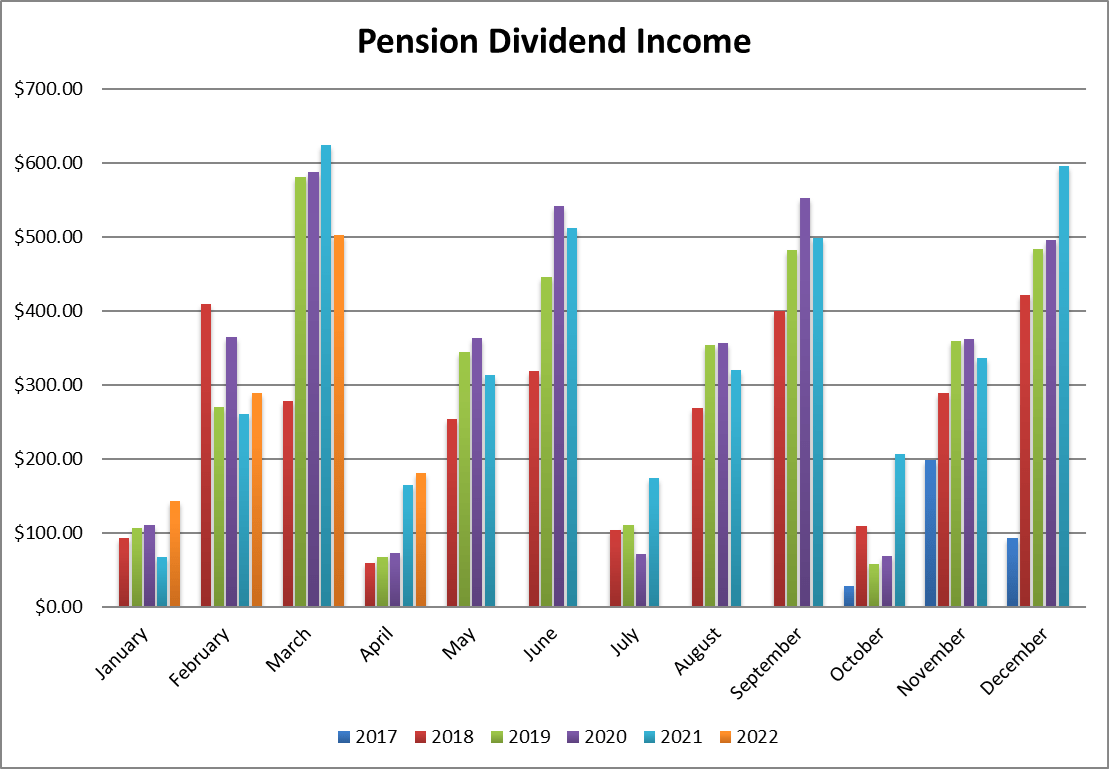
This was a good month compared to last year. I enjoyed dividend increases from Algonquin, Couche-Tard and Granite started paying dividends in my portfolio (this compensates for Andrew Peller that I sold not too long ago).
I’ve mentioned this before, but I’m still annoyed by Gentex’s no dividend growth policy. At one point, I’ll have to reconsider this investment if the company doesn’t get back on track. While the other metrics are okay considering the situation and the balance sheet remains strong with virtually no debt, I can’t get outside of my investing strategy and start making several exceptions. This will be on the top of my mind throughout the rest of the year.
Here are the detail of my dividend payments.
Dividend growth (over the past 12 months):
- Algonquin: +9.7%
- Granite: New
- Alimentation Couche-Tard: +25.72%
- Gentex: 0% (annoying)
- Currency factor: +4.4%
Canadian Holding payouts: $144.61 CAD
- Algonquin: $72.06
- Granite: $33.06
- Alimentation Couche-Tard: $39.49
U.S. Holding payouts: $28.20 USD
Total payouts: $180.59 CAD
*I used a USD/CAD conversion rate of 1.267
Since I started this portfolio in September 2017, I have received a total of $16,124.60 CAD in dividends. Keep in mind that this is a “pure dividend growth portfolio” as no capital can be added to this account other than retained and/or reinvested dividends. Therefore, all dividend growth is coming from the stocks and not from any additional capital being added to the account.
Author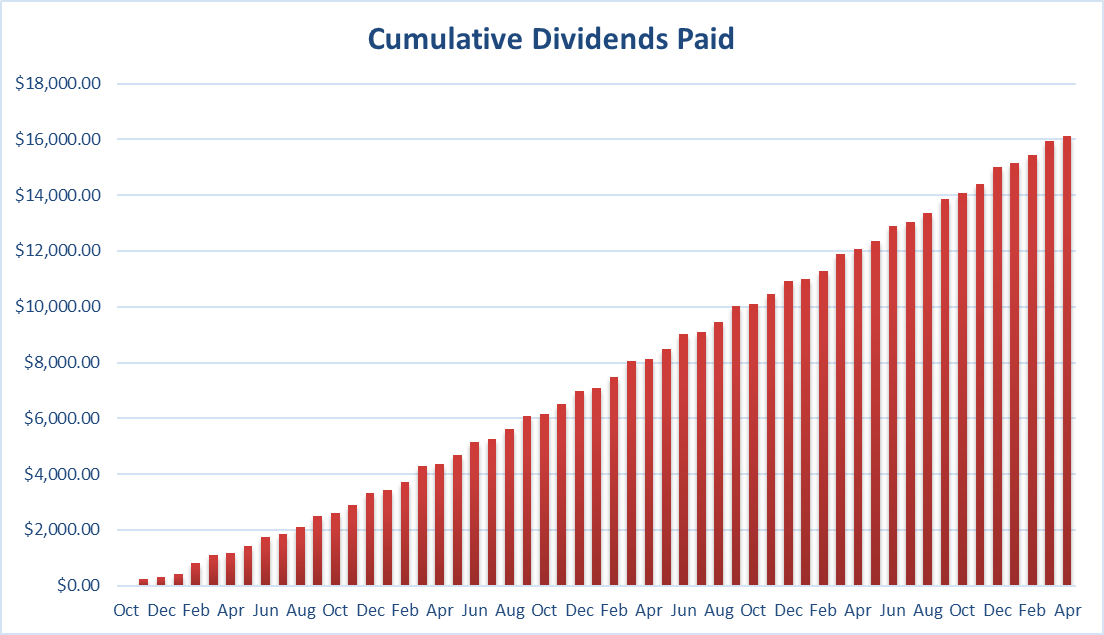
Final Thoughts
While this was a tough month on the market, I’m happy to see my dividends increase. When the market goes sideways or down and I start “losing paper money”, it’s important to remember three things:
#1 My portfolio’s long-term return (I’m still outperforming the market)
#2 My dividend growth (going up… always going up!)
#3 My investment strategy (I’m in for the next 40-50 years, not 4-5 months!).
Cheers,
Mike.
Editor’s Note: The summary bullets for this article were chosen by Seeking Alpha editors.
